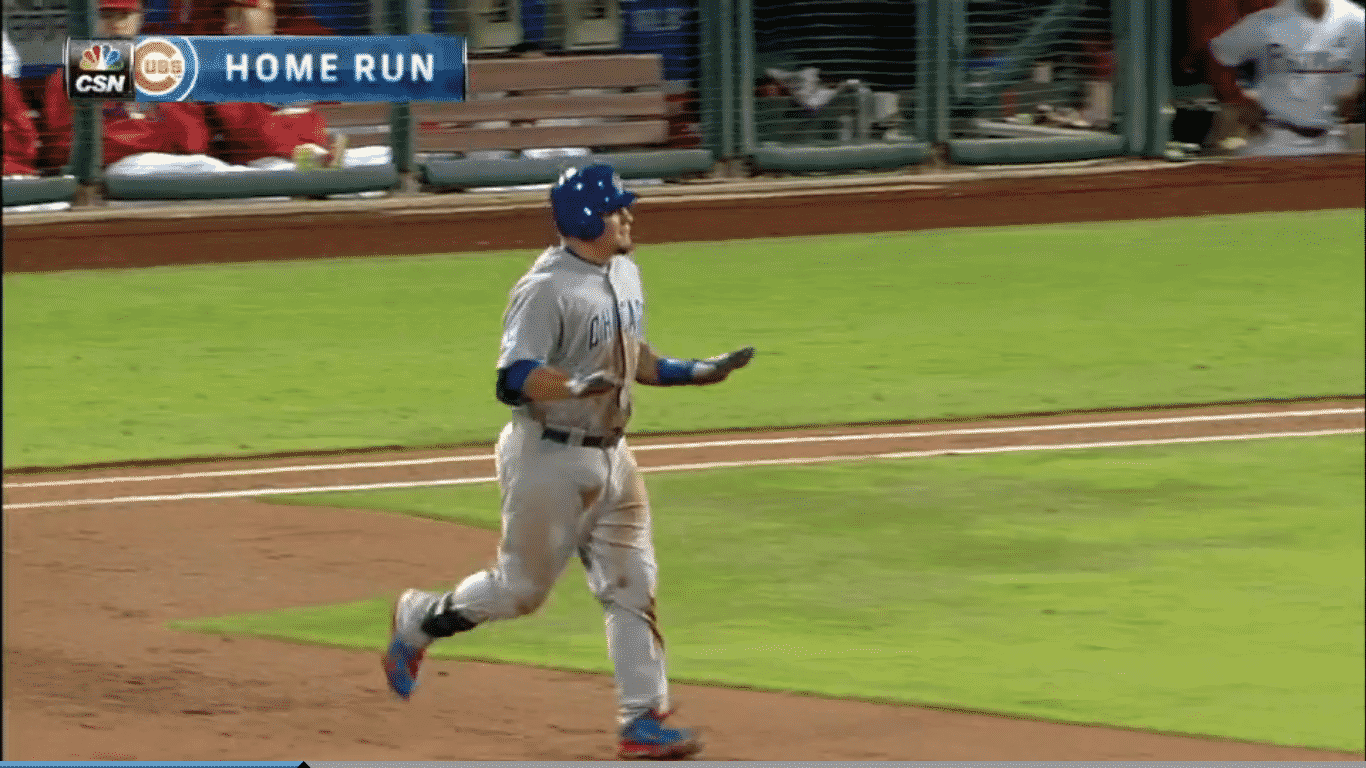
Kyle Schwarber Has Been Soooooo Unlucky This Season
I can say with great certainty that Kyle Schwarber has been unlucky this season.
Posts centered around a player’s misfortune typically start with batting average on balls in play (BABIP). “The BABIP gods were not kind today,” has been a phrase frequently uttered by not just the Twitterverse, but even Len Kasper himself. While BABIP is one page of the story, we now have much better tools that can isolate the opposing team’s defensive alignment, ability, and ballpark, including xStats and MLB Advanced Media resources.
In this post, we’ll discuss exactly why Schwarber should be creating more runs. And no, it’s not because he wasn’t the right fit as a leadoff hitter. First up…
Expected statistics (xStats)
Statcast has given data scientists the ability to create reliable, valid markers of expected run value. One of the best tools today is xStats, created by Andrew Perpetua. xStats is based on launch angle, exit velocity, and batted ball location, permitting fans to answer many of questions we might have as to why certain players are or aren’t doing what we expect.
The methods driving xStats data are comprehensive, with buckets of data points that would give you carpal tunnel if you sought to scroll through all the numbers. Perpetua’s metrics are even more in-depth than MLB Advanced Media’s new expected stats, as they take into account in ballpark factors, both horizontal and vertical batted ball location, and more. If you would like to learn more about xStats, click here for Perpetua’s explanations.
According to several xStats metrics, Schwarber has indeed been the victim of the baseball gods. His production has been driven by such misfortune that the Cubs left fielder ranks in the top 3 percent of the league’s unluckiest hitters. Going into Sunday’s contest against the Brewers, Schwarber had an underwhelming .293 wOBA. But his expected wOBA (xOBA) was .345, a difference that ranks 13th among 316 qualified hitters with at least 75 plate appearances.
Such a stark difference between his expected and actual run values exists because Schwarber has had several base hits stolen from him.
| 1B | 2B | 3B | HR | |
| xStats | 19 | 8 | 1 | 7 |
| Actual | 14 | 7 | 0 | 6 |
If those base hits had fallen, his BABIP of .226 would instead be .305 and his slugging percentage of .351 would roll up to .444. That’s not bad. Know what is?
Schwarber’s missiles have been caught
Below is a Baseball Savant radial chart that represents Schwarber’s entire batted-ball profile. The edge of the hemisphere represents 120 MPH, and the inward data points represent weaker-hit pitches. Just counting the number of outs in high exit velocity and favorable zones shows Schwarbs has been unlucky. Even four of his “barrels,” which normally lead to minimum .500 batting average and 1.500 slugging percentage, have been caught for outs. That sucks.
Contact rate
Not only has Schwarber had his rockets caught by defenders, but even his strike out rate doesn’t match his contact rate. Whereas his 76.2 percent contact rate is just a bit below the league average of 77.6, his strikeout rate of 28.2 percent is far above the usual 22 percent rate. Hitters making similar contact usually walk back to the dugout defeated around, you guessed it, 22-24 percent of the time.
His current strikeout rate will not last. I repeat: His current strikeout rate will not last. Got it? Good.
Conclusion
Granted, even a .345 wOBA is probably not what you expected from Schwarber. Plus, his recent exit velocity has gone down. I can’t help but think the slump has messed with the slugger’s psyche.
Joe Maddon might be trying to boost Schwarber’s mindset by moving him down to the second spot in order to avoid shifts.
“We’ve talked a lot about Kyle hitting balls into the shift,” Maddon explained. “If in fact Zo can get on a little bit more often, it might move that second baseman out of that spot. I don’t know.”
Overall, though, don’t worry about Kyle Schwarber. This type of misfortune simply isn’t sustainable.


